
| Statistics
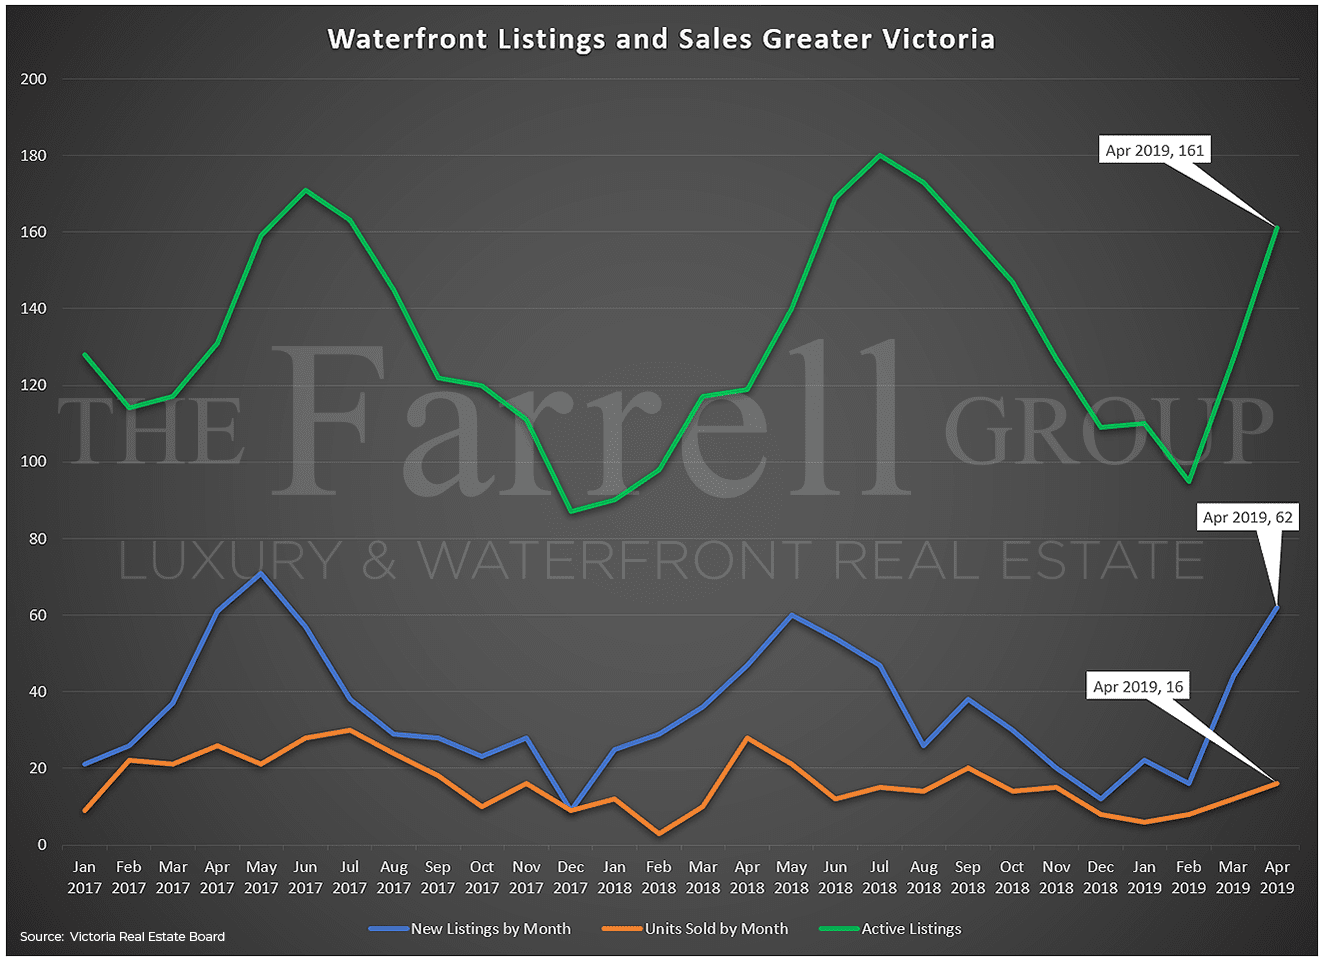
Waterfront Sales in Victoria – Update for May 2019
Waterfront sales, active and new listings are all trending up as part of the normal spring market cycle — Volumes are starting to return to…
| Statistics
April 2019 Month-End Statistics
The April 2019 month-end statistics finds unit sales are down 10.1% from the previous month last year, while new listings are up 7.8% from 2018…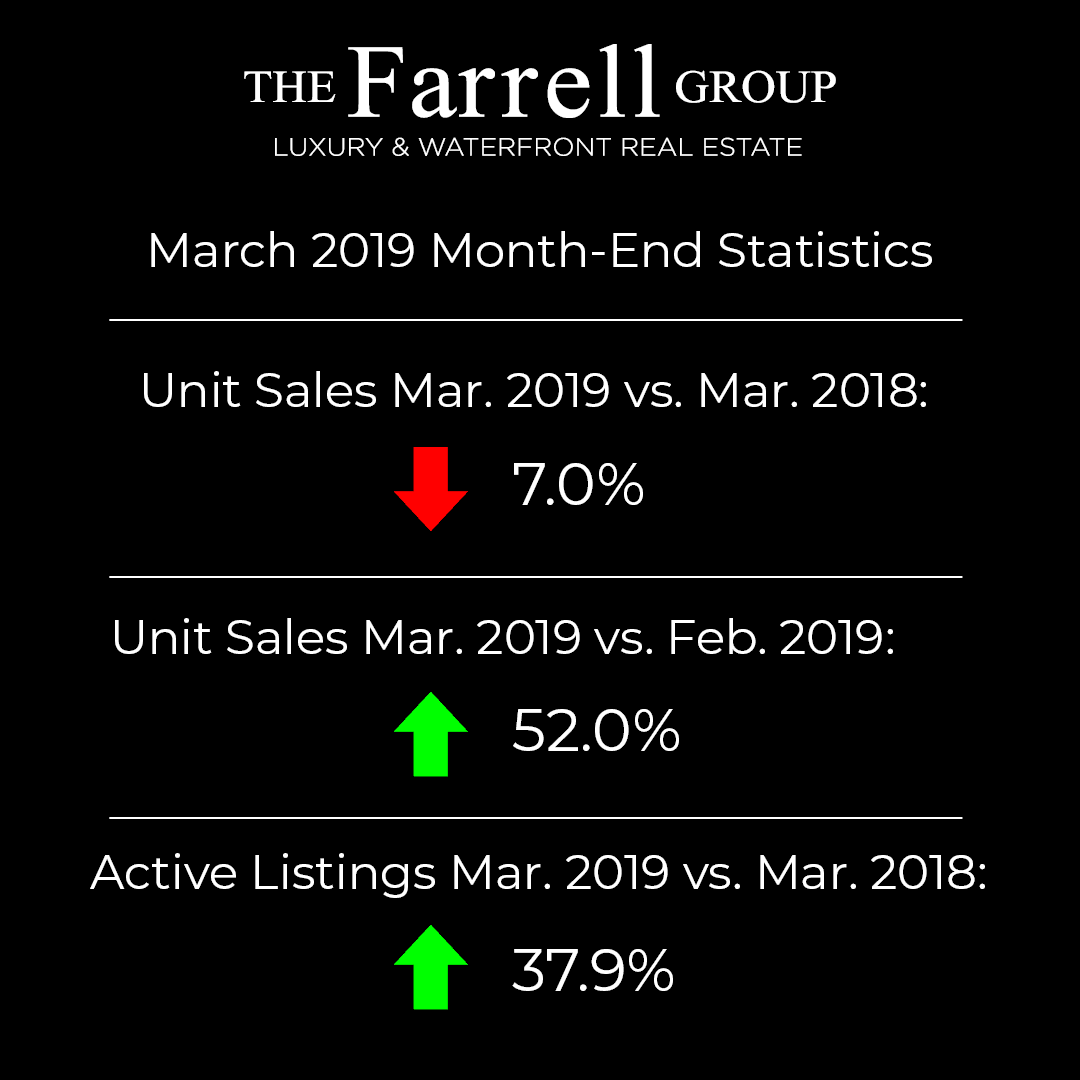
| Statistics
March 2019 Month End MLS® Statistics
March 2019 Month End MLS® Statistics. Unit sales are down compared to a year ago, however, they are greatly increased over February of this year.…
| Statistics
December Month-End Statistics
The month-end statistics (graphic below) for December were once again in line with expectations. Although unit sales and inventory were down and up, respectively, this…
| Statistics
Days On Market – November Statistics Update
As indicated in the graph below, the median days on market (DOM) continues to rise in Greater Victoria, up approximately 55% in 2018 for the…
| Statistics
November 2018 Month-End Statistics
The November 2018 month-end statistics are in line with expectations – lower unit sales and higher inventory are evident compared to November 2017 because most…
| Statistics
Comparing Sales by Price Range for 2018 vs 2017
This graph shows sales in Greater Victoria broken down into price increments of $100,000, for both 2018 and 2017. The time range is January to…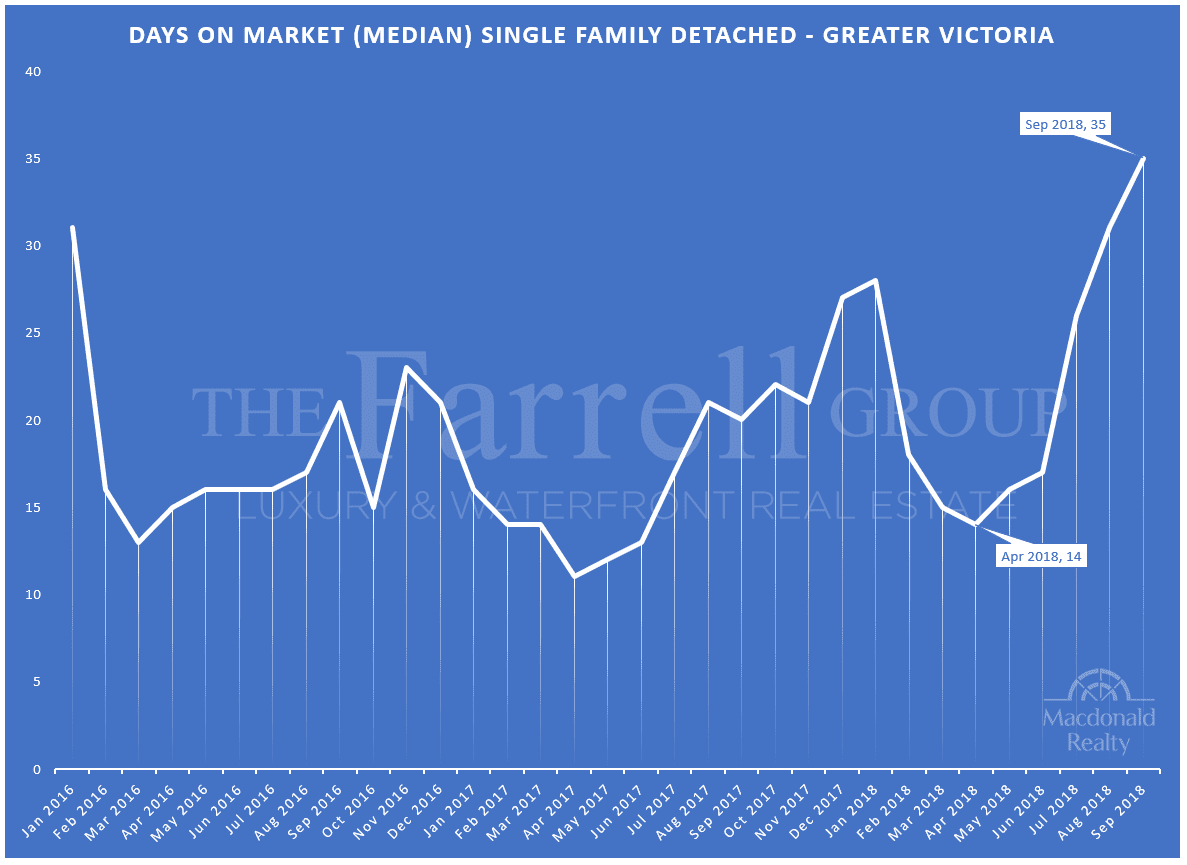
| Statistics