
| Statistics
This graph shows sales in Greater Victoria broken down into price increments of $100,000, for both 2018 and 2017.
The time range is January to October for both years.
Please contact us to discuss the current statistics, trends and factors affecting real estate in Greater Victoria and to discuss a complimentary evaluation of your home.
Thanks for reading!
The Farrell Group.
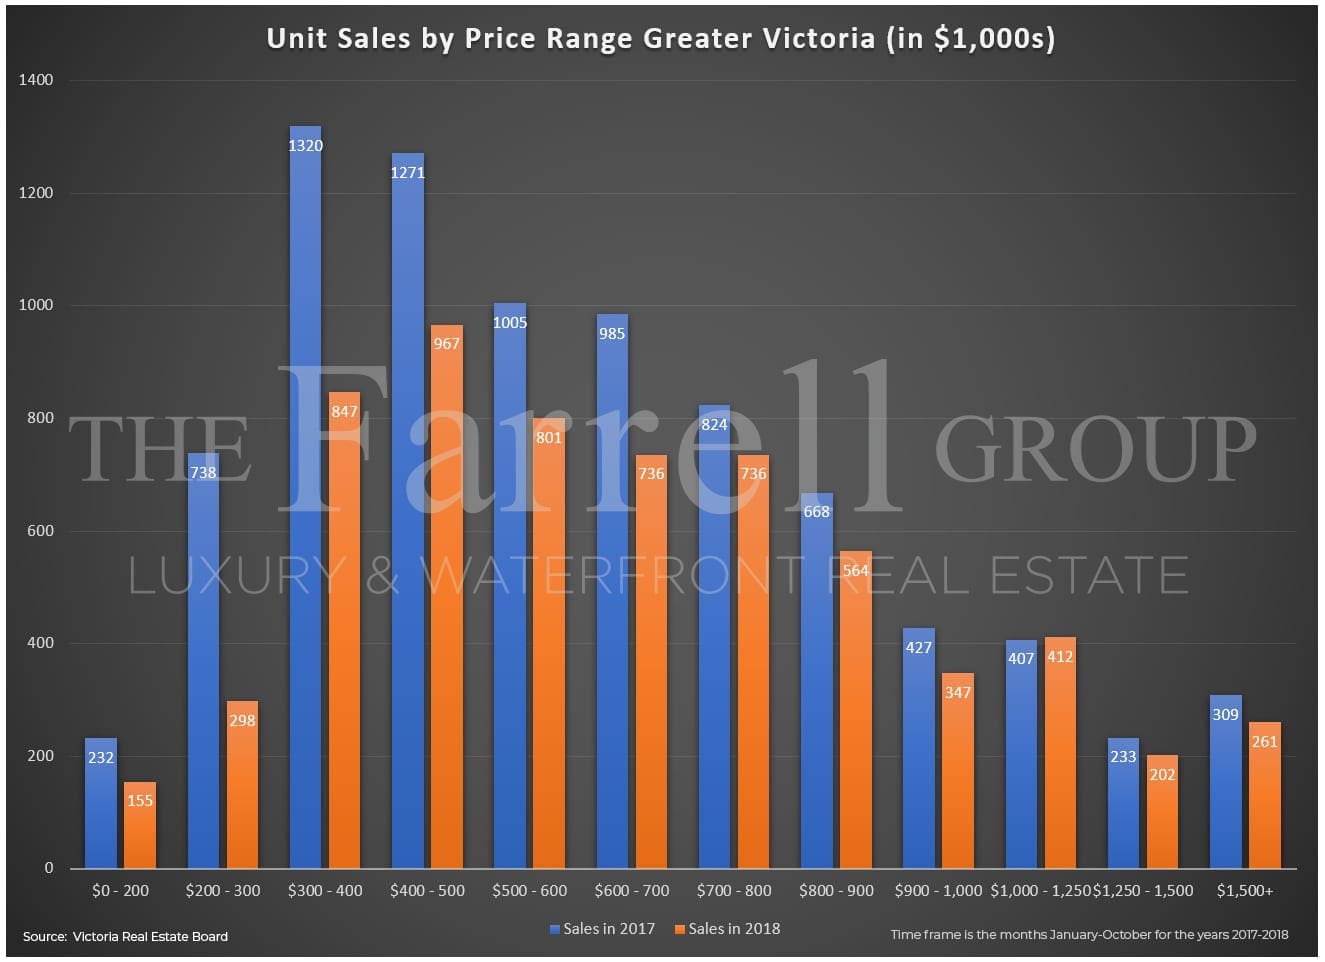
Click for larger version