
| Statistics
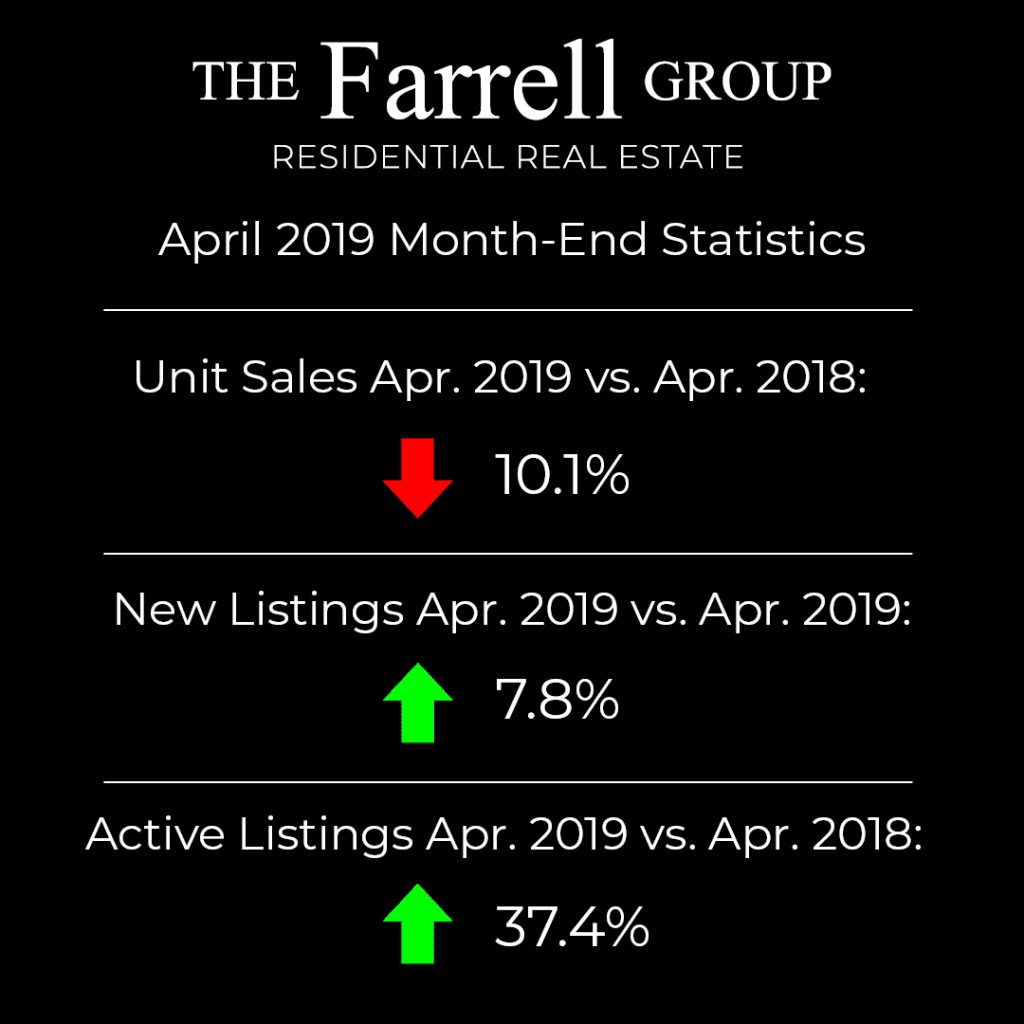
The April 2019 month-end statistics finds unit sales are down 10.1% from the previous month last year, while new listings are up 7.8% from 2018 and the overall inventory continues to climb from record-low levels in 2018, now up 37.4% over last year.
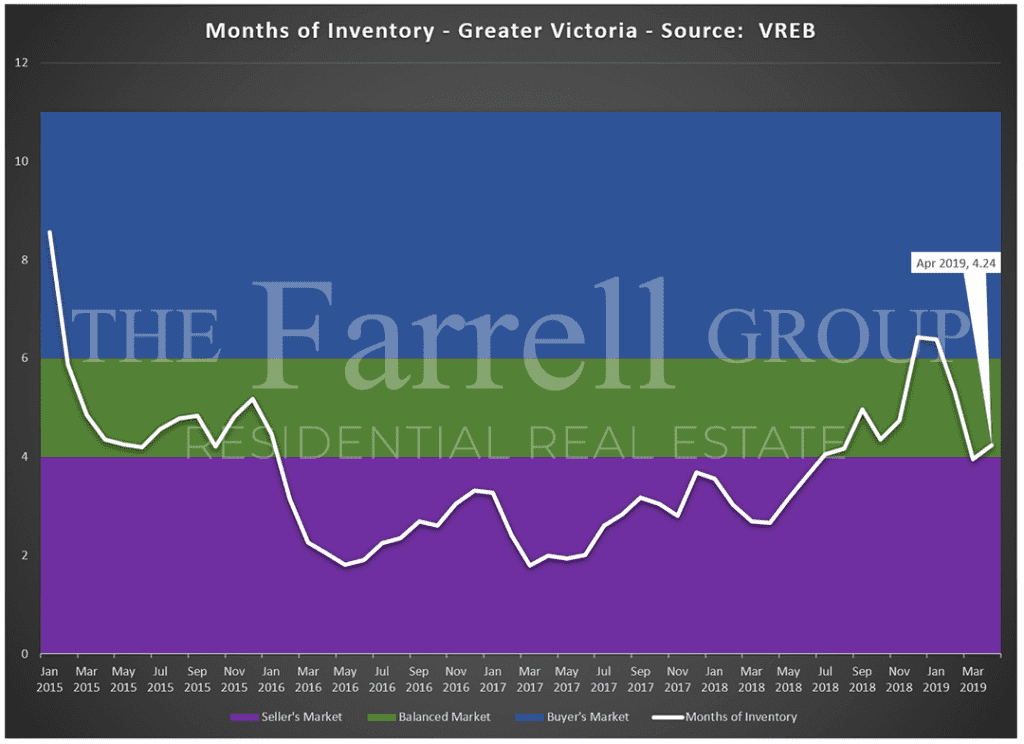
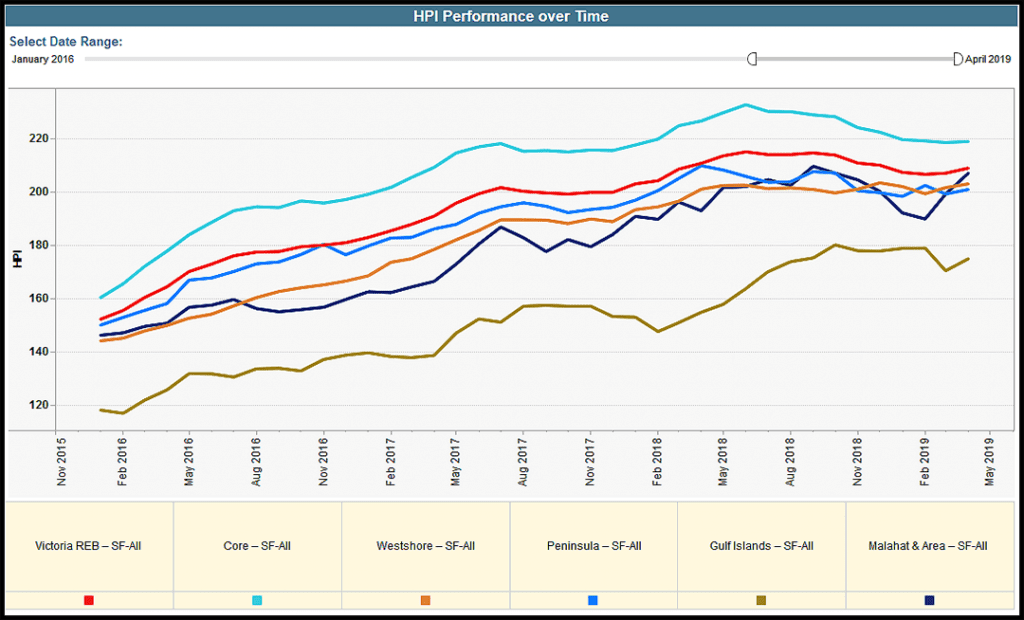
At first glance the rising inventory stands out, however, as the market is coming off record-low inventory levels there is enough pent-up demand that prices are stabilizing or rising, with the HPI stabilizing in the core municipalities and rising everywhere else (see HPI graph below).
This is further reflected in the months of inventory available, which for April stands at 4.24 months, just nudging into a balanced market from a brief foray into a seller’s market in March (see months inventory graph below). The months inventory is amount of time it would take to sell all current listings, at the current rate of sales, if no new listings came to market (also known as the absorption rate). We are currently seeing busy spring activity levels in this balanced market.
As each region and individual listing type has its own volume and price characteristics, be sure to contact us to discuss valuing property in Greater Victoria, whether you are a seller or a buyer looking to make a purchase and for all of your real estate needs in Victoria, BC.
All the best, The Farrell Group